
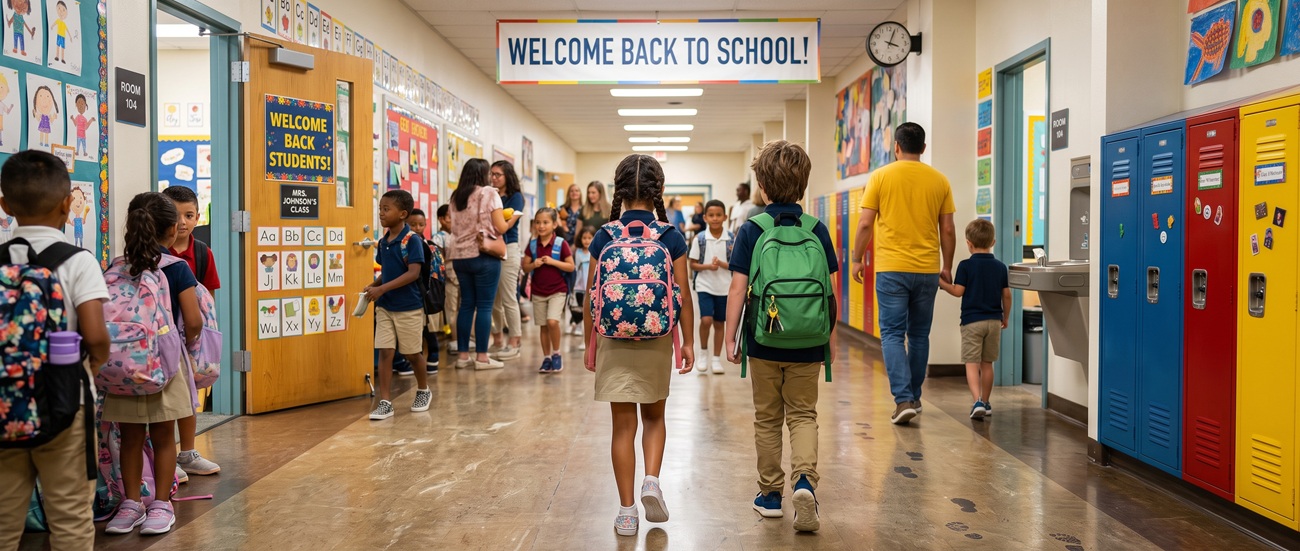
Back-to-school season is in full swing. Students in most Georgia districts already went back the first week of August, Texas and Kansas started back too, and Washington students have a few more weeks of summer left to hike, bike, and enjoy the PNW weather. But we know a whole slew of folks who make the school run, from teachers to front office to data teams to nutrition experts, have been back for weeks now.
The big news on our end: the tool we spent all of GAEL talking about is now live. Here's what's happening with FTE, plus a few other things worth your attention this month.
🚀 FTE Eligibility Identifier Is Live
At GAEL this July, FTE was the conversation at our booth. Districts wanted to know how they could make sure every eligible student is actually coded to receive the services, and the funding, they qualify for.
That tool for FTE funding optimization is now live in production with our first Georgia design partner district, with a full rollout on track for September 1. It cross-references student data against Georgia's QBE eligibility rules and flags exactly which students qualify for EIP, REP, or special ed services they aren't currently coded to receive. Before the count runs, not after.
Why the urgency: Georgia's Count Day 1 lands October 6 this year (first Tuesday in October) and carries two-thirds of your annual QBE weighting, with superintendent sign-off due October 22. Most Georgia districts went back the first week of August, which puts about eight weeks between the first bell and the transmission window opening. The coding decisions happening in your building right now, during scheduling and placement, are what that count will actually measure. There's no clean way to fix a miscoded student after the fact. Districts that find every dollar aren't scrambling in September. They're ready when the bell rings.
Right now, that mostly looks like screeners and schedules. Universal screener results are coming back and flagging students for EIP and MTSS support. IEP and 504 teams are finalizing service minutes for the year. English learner screeners are identifying which new students need WIDA-based support. Every one of those decisions needs to show up correctly in your SIS, not just on paper, because the count only sees what's coded, not what's true.
If we didn't get a chance to chat with you there, grab some time with us and we'll walk through it.
Not in Georgia? The underlying idea, that a data mismatch shouldn't be the reason a student doesn't get the services or funding they qualify for, applies everywhere. Ours is just built around Georgia's rules first.
📰 Also Worth Your Time
A few things from the wider world that caught our eye this month, FTE or not:
Cell phone policy looks completely different depending on where you are, and the research on why it matters is more interesting than the headlines suggest. A national report card graded every state this spring. Kansas earned an "A" for its full bell-to-bell ban, and Georgia's K-8 ban took effect this July, with high school following in 2027-28. Washington, well, let's just say they may need to go to summer school. GeekWire →
As for whether bans actually work: the evidence is genuinely mixed. A National Bureau of Economic Research study of more than 40,000 schools found that phone-pouch bans improved student and teacher well-being but didn't move test scores or attendance. A separate study in the Journal of Human Resources found no average effect on grades or mental health overall, but did find bans reduced bullying for all students and improved GPAs specifically for girls, especially those from disadvantaged backgrounds. The honest takeaway: a policy on paper isn't a fix by itself, but it's clearly not nothing either, particularly for the students who need it most. Worth keeping in mind if your district is revisiting, defending, or enforcing your own policy this fall. NBER study coverage →
We're all about AI here at StandardEd, and we were curious how folks in the education field are using it. It's no surprise to us that AI use among teachers nearly doubled in two years, and it's mostly going toward prep work, not instruction. 61% of teachers now use AI tools in their work, up from 32% in 2024, according to EdWeek Research Center survey data. Per a Gallup/Walton Family Foundation survey, the top uses are research and content gathering (44%), building lesson plans (38%), summarizing information (38%), and generating classroom materials (37%), the time-consuming stuff, not the teaching itself. Education Week →
🔧 What We're Working On
The MTSS Coordinator Dashboard ("Meeting Mode") has a working V1 running on practice data. Next step: getting it in front of a real intervention team meeting to see if one cross-domain view (attendance, behavior, academics, SEL) actually changes the conversation in the room.
We're also rolling out self-service user management, so your team can handle routine account changes without looping us in.
👋 Before You Go
If you're still knee-deep in first-week chaos, hang in there. Hopefully everything evens out by Labor Day.